


Ottawa: Statistics released by the Canadian Real Estate Association (CREA) show national home sales set another all-time record in March 2021 as increased supply became available.
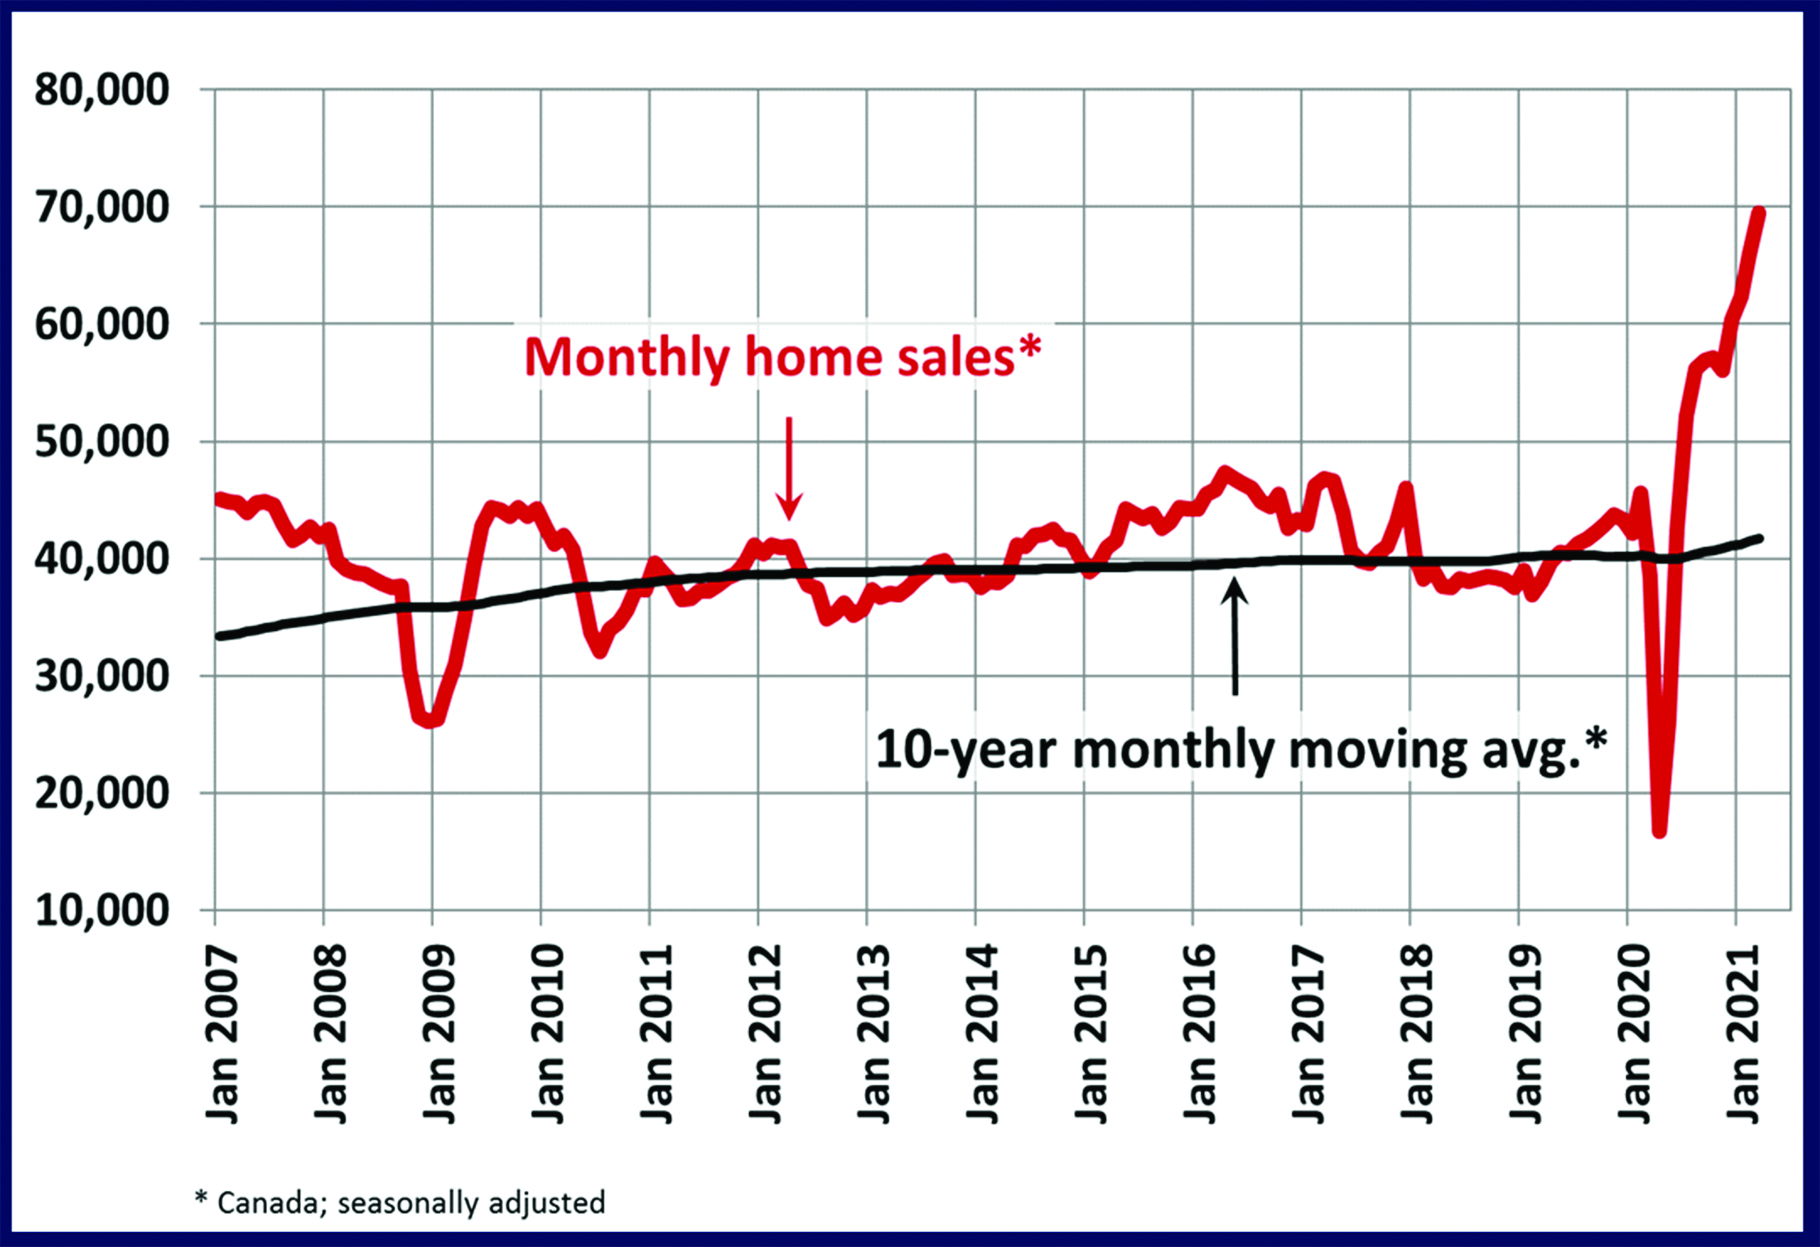
Home sales recorded over Canadian MLS® Systems climbed 5.2% between February and March 2021 to set another new all-time record.
In the face of continuing strong demand, the increase in sales was likely the result of an increase in new supply.
The month-over-month increase in national sales activity from February to March was broad-based and generally in line with locations where more new listings became available.
Sales gains were largest in March in Greater Vancouver, Calgary, Edmonton, Hamilton-Burlington and Ottawa. Actual (not seasonally adjusted) sales activity posted a 76.2% y-o-y gain in March, though year-overyear comparisons will be extremely stretched this spring because of last year’s initial lockdown period.
In line with heightened activity since last summer, sales set a new record for the month of March by a considerable margin (almost 22,000 transactions).
In fact, the 76,259 residential properties that traded hands via Canadian MLS® Systems in March 2021 marked the highest level of activity of any month in history, nearly 14,000 more sales than the previous record set last July.
“Seeing how many homes were bought and sold in March 2021, one could be forgiven for thinking the market just continues to strengthen, and maybe to some extent it is,” stated Cliff Stevenson, Chair of CREA.
“The real issue is not strength in housing markets but imbalance. That demand has been around for months, but with the shortages in supply we have across so much of Canada, a lot of that demand has been pressuring prices. So the big rebound in new supply to start the spring market is the relief valve we need the most to get that demand playing out more on the sales side of things and less on the price side.
“That said, it will take a lot more than one month of record new listings, but it looks like we may finally be rounding the corner on these extremely unbalanced housing market conditions. It’s great news for frustrated buyers, who should consult with a local REALTOR® for the best information and guidance about buying or selling a home this year,” continued Stevenson.
“We spent a lot of time over the last year talking about pent-up demand, but I think now is a good time to talk about pent-up supply, which may be the answer to the question everyone is asking right now,” said Shaun Cathcart, CREA’s Senior Economist.
“2020 was the year that home became everything, so in hindsight it’s not that surprising that so many people who did not have one in which to ride out the pandemic really wanted one, while so many of those who did have a home to hunker down in were not inclined to give it up.
“It stands to reason then, that as the uncertainty caused and danger posed by COVID wind down, some owners who would not sell during a global pandemic will emerge with properties for sale, while at the same time some of the urgency on the demand side could dissipate.
We’ll only know in the fullness of time, but March certainly did nothing to disprove the idea. That said, the third wave of COVID-19 could throw a wrench into the works of a potential supply recovery this spring.”
The number of newly listed homes climbed a further 7.5% to set a new record in March. Together with February’s big rebound, new supply is up more than 25% in the last two months.
With the rebound in new supply outpacing recent gains in sales, the national sales-to-new listings ratio eased back to 80.5% in March compared to a peak level of 90.9% set in January. The long-term average for the national sales-to-new listings ratio is 54.4%, so it is currently still very high historically. The good news is it appears to finally be moving in the right direction.
Based on a comparison of sales to-new listings ratio with long-term averages, less than 20% of all local markets were in the balanced market territory in March, measured as being within one standard deviation of their long-term average. The other 80%+ of markets were above long-term norms, in many cases well above.
The number of months of inventory is another important measure of the balance between sales and the supply of listings. It represents how long it would take to liquidate current inventories at the current rate of sales activity.
There were only 1.7 months of inventory on a national basis at the end of March 2021 – the lowest reading on record for this measure.
The long-term average for this measure is a little over five months. The Aggregate Composite MLS® Home Price Index (MLS® HPI) climbed by 3.1% mo-m in March 2021 – similar to but slightly less than the record gain in February.
While price growth remains largest in the single-family home space, the pace of those gains decelerated in March while price gains in the more affordable townhome and apartment segments continued to pick up steam. Of the 41 markets now tracked by the index, all but one were up on a m-o-m basis.
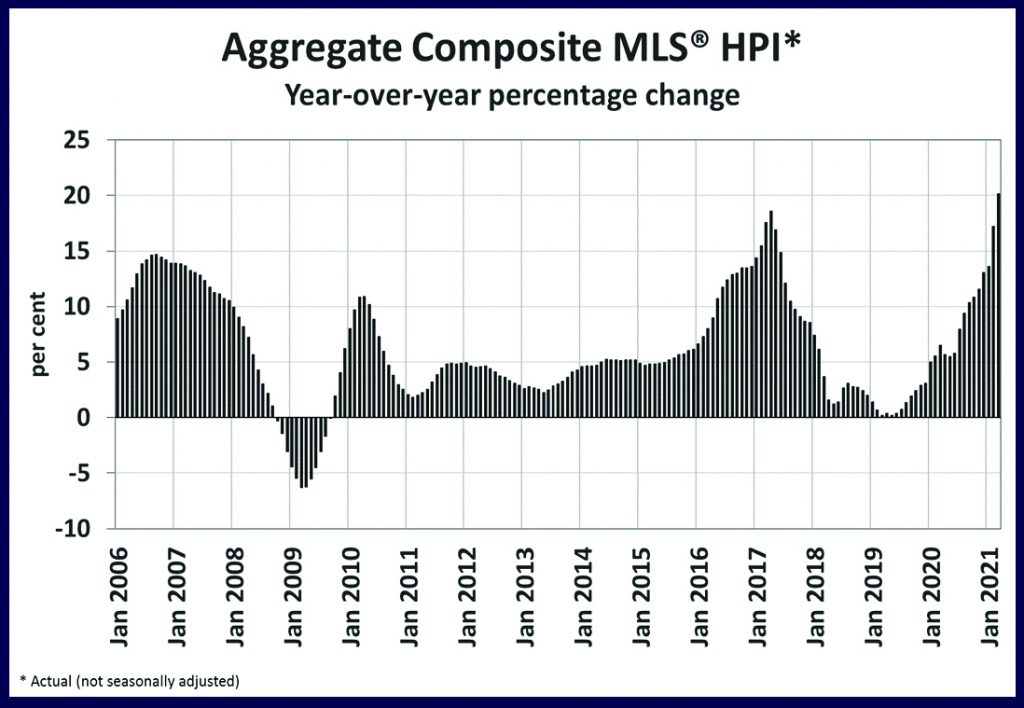
The non-seasonally adjusted Aggregate Composite MLS® HPI was up 20.1% on a y-o-y basis in March. Based on data back to 2005, this was a record y-o-y increase, surpassing the previous record of 18.6% set back in April 2017.
The largest y-o-y gains continue to be posted across Ontario, followed by markets in B.C., Quebec and New Brunswick, then by singledigit gains in the Prairie provinces and Newfoundland and Labrador.
The MLS® HPI provides the best way to gauge price trends because averages are strongly distorted by changes in the mix of sales activity from one month to the next.
The actual (not seasonally adjusted) national average home price was a record $716,828 in March 2021, up 31.6% from the same month last year. That said, it is important note that the biggest increase in new supply and thus sales in March was in Greater Vancouver, which raised that market’s share of national activity to its highest level in almost four years.
The national average price is heavily influenced by sales in Greater Vancouver and the GTA,
two of Canada’s most active and expensive housing markets. Excluding these two markets from calculations cuts more than $160,000 from the national average price.